From the viewer to the next step, you have to understand and trust. For the YouTube data baseline, you have to use a consistent theme and distribution method to form a normal space, and then test the variables one by one.
The official data sets the basic boundary for “how the new YouTube channel establishes a data baseline.” YouTube provides different reports on exposure, traffic sources, viewers, viewers, and income.
Write action as a tickable inspection item will be more stable: a series of similar videos will be released continuously, recording exposure, click, view, return and conversion, and using a median number. Each completed item should correspond to a file, image, text or backstage record.
The common bias is the small sample of the new channel, and the occasional performance of a single video is easily used as a regular rule. This allows the team to attribute the results to the platform without checking the consistency of content commitments, audiences and conditions of implementation.
The effects are judged in four to eight weeks by content group, rather than by mixing all the videos.
If the subject matter is related to the product page, the case page or the help page, this section can be given the role of explaining the problem and then connect to the next step with a descriptive anchor text, avoiding competition among several similar pages.
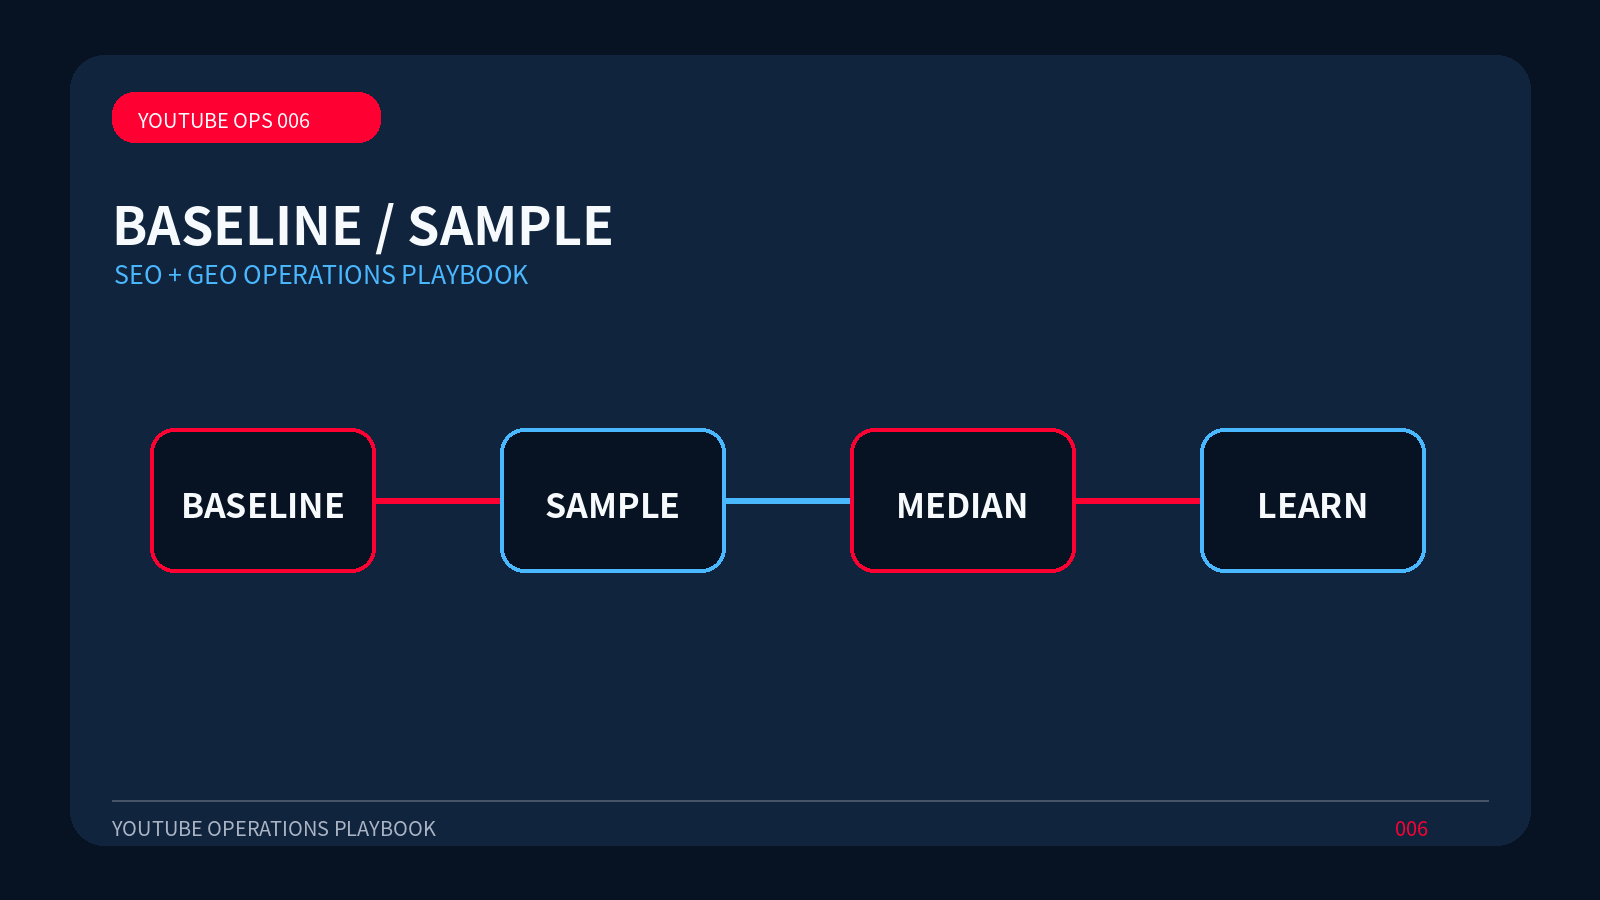
In order for the YouTube data baseline to be reproduced, the project record should include the target market, the material version, the release time and four check points: BASELINE, SAMPLE, MEDIAN, LEARN.
The same term may be used in different markets for different products or buying habits.
When the data are insufficient, the channel’s own normal space is created.
What needs to be avoided is that a premature pursuit of the so-called industry average would deprive the channel of its own basis of judgement.